Greenbacker delivers third quarter results
Company posts year-over-year IPP revenue growth, delivers 693,000 MWh of clean power, and achieves construction milestone at flagship solar project—the largest in New York State.
Key quarterly updates
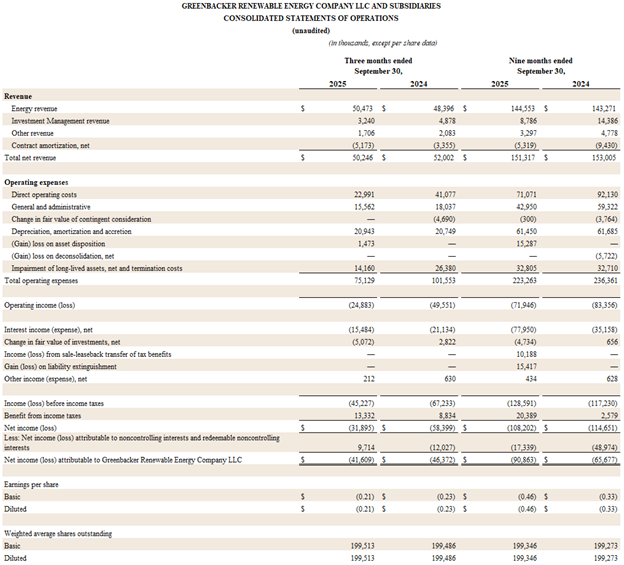
- IPP generates total operating revenue of $52 million in the quarter, representing 3% year-over-year increase, driven by wind and solar PPA revenue of $41 million; increase reflects solid performance from Company’s core operating fleet and strategic timing around sale of RECs generated by clean energy projects.
- Portfolio of clean power assets produced 693,000 MWh of sustainable domestic energy, enough to power approximately 64,000 average U.S. homes for one year.
- Construction management team achieves critical milestone on Greenbacker’s flagship Cider project, transporting and delivering main power transformers to New York’s largest solar farm to date.
- Company continued to execute on construction of pre-operating fleet, placing 20 assets into commercial operation, representing 64 MW of new solar generation capacity and 6 MWh of additional energy storage, year over year.
- Company formally announces engagement of Morgan Stanley and Wells Fargo to advise on strategic review focused on supporting positive outcomes for shareholders by potentially providing liquidity and long-term growth for the Company.
- Greenbacker’s sustainable infrastructure assets contribute to more resilient and secure national energy system; since 2016, Company has generated 13.9 million MWh of energy,i abated 9.3 million metric tons of carbon,ii conserved nearly 10 billion gallons of water,iii and supported thousands of energy-related jobs,iv while delivering power to communities and businesses across the U.S.
NEW YORK, December 4, 2025 – Greenbacker Renewable Energy Company, LLC (“Greenbacker” or the “Company”), an energy transition-focused investment manager and independent power producer (“IPP”), has announced financial results and operational updates for the third quarter of 2025.v
“Greenbacker’s performance this quarter underscores the strength of our core operating fleet and the resilience of our business model,” said Dan de Boer, CEO of Greenbacker. “Our teams not only drove revenue growth but also achieved critical milestones on flagship projects that will power communities for decades to come. These results reflect our commitment to accelerating the energy transition and creating long-term value for our shareholders.”
Construction management team delivers 200-ton power transformers to solar site
IPP generates total operating revenue of $52 million in the quarter, representing 3% year-over-year increase, driven by wind and solar PPA revenue of $41 million, as fleets produced 693,000 MWh of power.
Greenbacker generated total operating revenue of $52.2 million within its independent power producer (“IPP”) segment during the third quarter of 2025, as the Company’s wind and solar fleets produced approximately 693 million kWh of clean energy. This was driven by revenue from the long-term power purchase agreements (“PPAs”) in place across the Company’s wind and solar fleets, which generated a combined $40.7 million.
The $52.2 million revenue represents a year-over-year increase of 3%, or approximately $1.7 million of additional revenue in the quarter. This increase occurred despite a 2.3% year-over-year decrease in operating fleet capacity—as Greenbacker continued to advance its strategic focus on scaled clean energy projects via the sale of smaller non-core asset sales. The revenue increase reflects Greenbacker’s strategic timing around the sale of renewable energy credits (“RECs”) generated by its portfolio of renewable energy projects, as well as continued solid performance from the higher-impact assets across the Company’s core operating fleet.
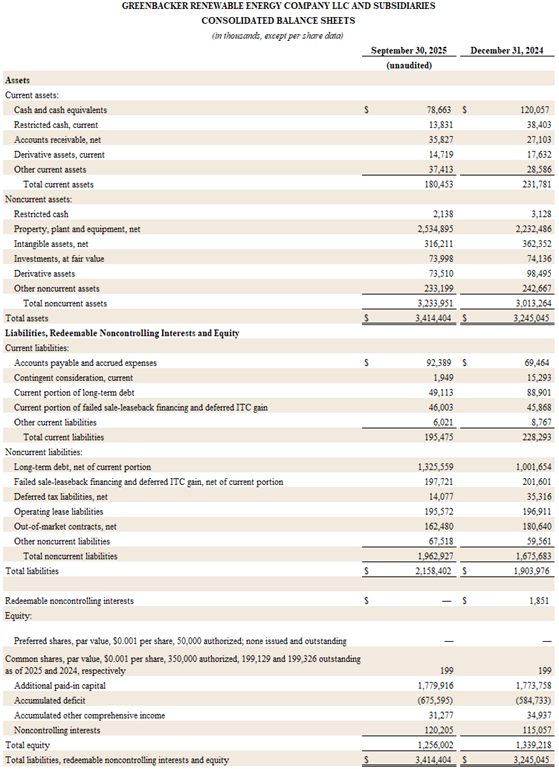
Third-quarter net loss attributable to Greenbacker in 2025 was $(41.6) million, a favorable year-over-year change of 10%, driven by fewer impairment charges in the quarter compared with the prior year. Adjusted EBTIDAvi was $25.2 million, a year-over-year increase $23.2 million. This significant increase was largely the result of the termination and related non-recurring expenses associated with a module supply agreement incurred in 2024, as well as the Company’s ongoing cost reduction efforts, both of which contributed to the significant comparative increase on a year-over-year basis.
Some figures may not add to stated totals due to rounding. Total clean power generated does not include assets in which the Company holds a preferred equity position.
Greenbacker continues to advance review of strategic alternatives designed to support positive outcomes for shareholders and long-term growth for the Company.
As announced earlier this year, the Greenbacker Board of Directors (“Board”) is actively reviewing a full range of operational and financial alternatives aimed at aligning with shareholder interests—including potential liquidity options—and positioning the Company for sustained growth.
To assist with this review, Greenbacker has retained Morgan Stanley and Wells Fargo as financial advisors. The strategic review remains ongoing, and the Board is committed to a disciplined, rigorous process focused on creating long-term value for shareholders.
***
About Greenbacker Renewable Energy Company
Greenbacker Renewable Energy Company LLC is a publicly reporting, non-traded limited liability sustainable infrastructure company that both acquires and manages income-producing renewable energy and other energy-related businesses, including solar and wind farms, and provides investment management services to other renewable energy investment vehicles. We seek to acquire and operate high-quality projects that sell clean power under long-term contracts to high-creditworthy counterparties such as utilities, municipalities, and corporations. We are long-term owner-operators, who strive to be good stewards of the land and responsible members of the communities in which we operate. Greenbacker conducts its investment management business through its wholly owned subsidiary, Greenbacker Capital Management, LLC, an SEC-registered investment adviser. We believe our focus on power production and asset management creates value that we can then pass on to our shareholders—while facilitating the transition toward a clean energy future. For more information, please visit https://greenbackercapital.com.
About Greenbacker Capital Management
Greenbacker Capital Management LLC is an SEC registered investment adviser that provides advisory and oversight services related to project development, acquisition, and operations in the renewable energy, energy efficiency, and sustainability industries. For more information, please visit www.greenbackercapital.com.
Forward-Looking Statements
This press release contains forward-looking statements within the meaning of the federal securities laws. Forward-looking statements are not guarantees of future performance and involve known and unknown risks, uncertainties and other factors that may cause the actual results to differ materially from those anticipated at the time the forward-looking statements are made. Although Greenbacker believes the expectations reflected in such forward-looking statements are based upon reasonable assumptions, it can give no assurance that the expectations will be attained or that any deviation will not be material. Greenbacker undertakes no obligation to update any forward-looking statement contained herein to conform to actual results or changes in its expectations.
Private placements are speculative.
For financial professionals and their accredited investors only. Not for inspection by, distribution to, or quotation to the general public. There are material risks associated with investing in alternative investments including financing risks, general economic risks, long hold periods, and potential loss of the entire investment principal. Potential cash flow, returns, and appreciation are not guaranteed. The shares offered are illiquid assets for which there is not expected to be any secondary market, nor is it expected that any will develop in the future. The ability to transfer shares is limited. Pursuant to the LLC Agreement, Greenbacker has the discretion under certain circumstances to prohibit transfers of shares, or to refuse to consent to the admission of a transferee as a member. Securities offered through WealthForge Securities, LLC, Member FINRA/SIPC. Greenbacker Capital Management LLC and WealthForge Securities, LLC are separate entities.
Non-GAAP Financial Measures
In addition to evaluating the Company’s performance on a U.S. GAAP basis, the Company utilizes certain non-GAAP financial measures to analyze the operating performance of our segments as well as our consolidated business. Each of these measures should not be considered in isolation from or as superior to or as a substitute for other financial measures determined in accordance with U.S. GAAP, such as net income (loss) or operating income (loss). The Company uses these non-GAAP financial measures to supplement its U.S. GAAP results in order to provide a more complete understanding of the factors and trends affecting its operations.
Adjusted EBITDA
Adjusted EBITDA is a non-GAAP financial measure that the Company uses as a performance measure, as well as for internal planning purposes. We believe that Adjusted EBITDA is useful to management and investors in providing a measure of core financial performance adjusted to allow for comparisons of results of operations across reporting periods on a consistent basis, as it includes adjustments relating to items that are not indicative on the ongoing operating performance of the business.
Adjusted EBITDA is a performance measure used by management that is not calculated in accordance with U.S. GAAP. Adjusted EBITDA should not be considered in isolation from or as superior to or as a substitute for net income (loss), operating income (loss) or any other measure of financial performance calculated in accordance with U.S. GAAP. Additionally, our calculations of Adjusted EBITDA may not be comparable to similarly titled measures reported by other companies.
Funds From Operations (FFO)
FFO is a non-GAAP financial measure that the Company uses as a performance measure to analyze net earnings from operations without the effects of certain non-recurring items that are not indicative of the ongoing operating performance of the business. FFO is calculated using Adjusted EBITDA less the impact of interest expense (excluding the non-cash component) and distributions to tax equity investors under the financing facilities associated with our IPP segment. Distributions excluded to calculate the FFO do not include distributions made to Tax Equity Investors from the proceeds received from the transfer of investment tax credits to third parties.
The Company believes that the analysis and presentation of FFO will enhance our investor’s understanding of the ongoing performance of our operating business. FFO should not be considered in isolation from or as a superior to or as a substitute for net income (loss), operating income (loss) or any other measure of financial performance calculated in accordance with U.S. GAAP.
General Disclosure
This information has been prepared solely for informational purposes and is not an offer to buy or sell or a solicitation of an offer to buy or sell any security, or to participate in any trading or investment strategy. The information presented herein may involve Greenbacker’s views, estimates, assumptions, facts, and information from other sources that are believed to be accurate and reliable and are, as of the date this information is presented, subject to change without notice.
Non-GAAP Reconciliations
Adjusted EBITDA
Adjusted EBITDA is a non-GAAP financial measure that the Company uses as a performance measure as well as for internal planning purposes. We believe that Adjusted EBITDA is useful to management and investors in providing a measure of core financial performance adjusted to allow for comparisons of results of operations across reporting periods on a consistent basis as it includes adjustments relating to items that are not indicative of the ongoing operating performance of the business.
The Company defines Adjusted EBITDA as net income (loss) before: (i) interest expense; (ii) income taxes; (iii) depreciation expense; (iv) amortization expense (including contract amortization); (v) accretion; (vi) impairment of long-lived assets; (vii) amounts attributable to our redeemable and non-redeemable noncontrolling interests; (viii) unrealized gains and losses on financial instruments; (ix) gains and losses for asset dispositions; (x) other income (loss); and (xi) foreign currency gain (loss). Additionally, the Company further adjusts for the following items described below:
• Share-based compensation is excluded from Adjusted EBITDA as it is different from other forms of compensation as it is a non-cash expense and is highly variable. For example, a cash salary generally has a fixed and unvarying cash cost. In contrast, the expense associated with an equity-based award is generally unrelated to the amount of cash ultimately received by the employee, and the cost to the Company is based on a share-based compensation valuation methodology and underlying assumptions that may vary over time.
• The change in fair value of contingent consideration, which is related to the Acquisition, is excluded from Adjusted EBITDA, if any such change occurs during the period. The non-cash, mark-to-market adjustments are based on the expected achievement of revenue targets that are difficult to forecast and can be variable, making comparisons across historical and future quarters difficult to evaluate.
• Start-up costs associated with new investment strategies is excluded from Adjusted EBITDA. The Company evaluates new investment strategies on a regular basis and excludes start-up cost from Adjusted EBITDA until such time as a new strategy is determined to form part of the Company’s core investment management business.
• Placement fees, including internal sales commissions, related to fundraising efforts based on the capital raised, are excluded from Adjusted EBITDA. By excluding these fundraising-related fees from Adjusted EBITDA, we focus on core operational performance, separate from capital raising efforts, which might vary significantly from period to period.
• Other costs that are not consistently occurring, not reflective of expected future operating expense and provide no insight into the fundamentals of current or past operations of our business are excluded from Adjusted EBITDA. This includes costs such as professional services and legal fees, and other non-recurring costs unrelated to the ongoing operations of the Company.
Adjusted EBITDA is a performance measure used by management that is not calculated in accordance with U.S. GAAP. Adjusted EBITDA should not be considered in isolation from or as superior to or as a substitute for net income (loss), operating income (loss) or any other measure of financial performance calculated in accordance with U.S. GAAP. Additionally, our calculations of Adjusted EBITDA may not be comparable to similarly titled measures reported by other companies.
FFO
FFO is a non-GAAP financial measure that the Company uses as a performance measure to analyze net earnings from operations without the effects of certain non-recurring items that are not indicative of the ongoing operating performance of the business.
FFO is calculated using Adjusted EBITDA less the impact of interest expense (excluding the non-cash component) and distributions to Tax Equity Investors under the financing facilities associated with our IPP segment. The Company excludes these distributions as these are not recorded within Adjusted EBITDA and therefore not a component of our earnings from operations. Distributions excluded to calculate the FFO do not include distributions made to Tax Equity Investors from the proceeds received from the transfer of investment tax credits to third parties.
The Company believes that the analysis and presentation of FFO will enhance our investors’ understanding of the ongoing performance of our operating business. The Company considers FFO, in addition to other GAAP and non-GAAP measures, in assessing operating performance.
Adjusted EBITDA and FFO should not be considered in isolation from or as a superior to or as a substitute for net income (loss), operating income (loss) or any other measure of financial performance calculated in accordance with U.S. GAAP.
The following table reconciles Net loss attributable to Greenbacker Renewable Energy Company LLC to Adjusted EBITDA and FFO:

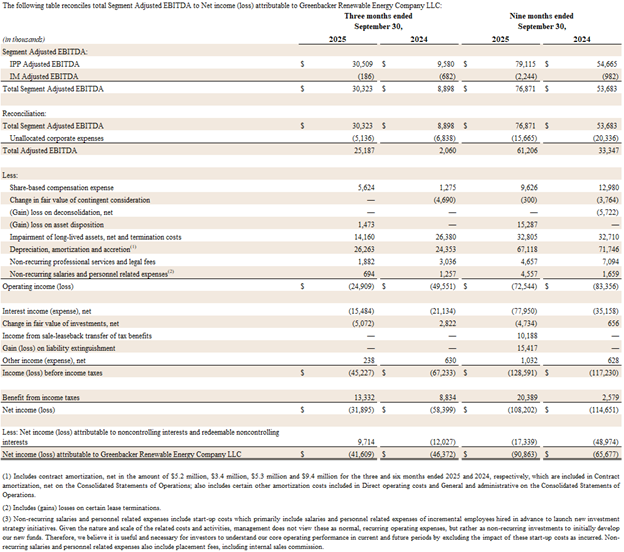
The following table reconciles total Segment Adjusted EBITDA to Net loss attributable to Greenbacker Renewable Energy Company LLC:
Greenbacker media contact
mediarelations@greenbackercapital.com
***
[i] Since January 2016.
[ii] Data reflects period from January 2016 through September 30, 2025. When compared with a similar amount of power generation from fossil fuels. Carbon abatement is calculated using the EPA Greenhouse Gas Equivalencies Calculator which uses the Avoided Emissions and generation Tool (AVERT) US national weighted average CO2 marginal emission rate to convert reductions of kilowatt-hours into avoided units of carbon dioxide emissions.
[iii] Data reflects period from January 2016 through September 30, 2025. Water saved by Greenbacker’s clean energy projects is compared to the amount of water needed to produce the same amount of power by burning coal. Gallons of water saved are calculated based on Operational water consumption and withdrawal factors for electricity generating technologies: a review of existing literature – IOPscience, J Macknick et al 2012 Environ. Res. Lett. 7 045802.
[iv] Data reflects period from January 2016 through September 30, 2025 and includes both jobs supported by operating and pre-operating assets and jobs expected to be supported by pre-operating assets. Green jobs calculated using The National Renewable Energy Laboratory (NREL) State Clean Energy Employment Projection Support, nrel.gov.
[v] The financial and portfolio metrics set forth herein are unaudited and subject to change. Data as of September 30, 2025. Total assets and megawatts statistics include those projects where we have contracted for the acquisition of the project pursuant to a Membership Interest Purchase Agreement (“MIPA”).
[vi] Adjusted EBITDA is a non-GAAP financial measure that the Company uses as a performance measure, as well as for internal planning purposes. We believe that Adjusted EBITDA is useful to management and investors in providing a measure of core financial performance adjusted to allow for comparisons of results of operations across reporting periods on a consistent basis, as it includes adjustments relating to items that are not indicative on the ongoing operating performance of the business. See “Non-GAAP Financial Measures” for additional discussion. Adjusted EBITDA is unaudited. See the Company’s 10-Q filed with the SEC for additional financial information and important related disclosures.