Greenbacker delivers second quarter results
Company executes strategic non-core asset sales, flagship project progress, and proactive project management to further strengthen financial position for long-term growth and profitability
Key Takeaways
- Greenbacker advanced commitment to scaled clean energy, fleet optimization, and long-term growth and profitability with 64-project portfolio sale, representing 51 MW of operating solar capacity.
- Company’s largest project to date continued construction unimpacted by legislative changes, including completing early delivery of one million solar modules to eliminate tariff risk and secure significant cost savings.
- Company continued to execute on core objective to construct pre-operating fleet, moving 19 assets into revenue-generating commercial operation, representing 74 MW of new generation capacity and over 16 MWh of additional energy storage, year over year.
- Wind and solar PPA revenue of $44 million contributed to total operating revenue of $51 million in quarter, as portfolios produced 824,000 MWh of power.
- 93% of portfolio contracted to sell power to investment-grade counterparties, providing highly predictable cash flows and positioning Company to deliver long-term value.
- Greenbacker’s assets contributed to more resilient and secure national energy system, delivering decarbonization, domestic economic impact, and homegrown power to communities and businesses across the U.S.
NEW YORK, August 28, 2025 – Greenbacker Renewable Energy Company, LLC (“Greenbacker” or the “Company”), an energy transition-focused investment manager and independent power producer (“IPP”), has announced operational updates and financial results for the second quarter of 2025.[1]
Strategic sale of 64-project portfolio reflects Greenbacker’s sharpened focus on scaled clean energy assets and fleet optimization, further strengthening its financial position for long-term growth and profitability
Greenbacker continued to execute on its strategic focus during the second quarter, advancing its commitment to scaled clean energy projects and optimizing its fleet of operating sustainable infrastructure assets. As part of this effort, the Company completed the sale of a 51 MW solar portfolio representing 68 interconnections[2] across 64 operating projects.
This transaction reflects Greenbacker’s broader strategy of further strengthening its financial position for long-term growth and profitability, while enhancing operational efficiency. By executing on selective non-core asset sales, Greenbacker can unlock capital to reinvest in core strategic areas, while at the same time reducing organizational complexity and simplifying the structure of its business.
By reallocating resources from smaller capacity projects to those with greater financial impact—including its 674 MW “Cider” solar farm—the Company is better positioned to accelerate deployment across its pre-operating portfolio and contribute to a more resilient and sustainable U.S. energy system.
Company’s largest project to date continued major construction, unimpacted by legislative changes, including taking early delivery of one million solar modules to manage tariff risk
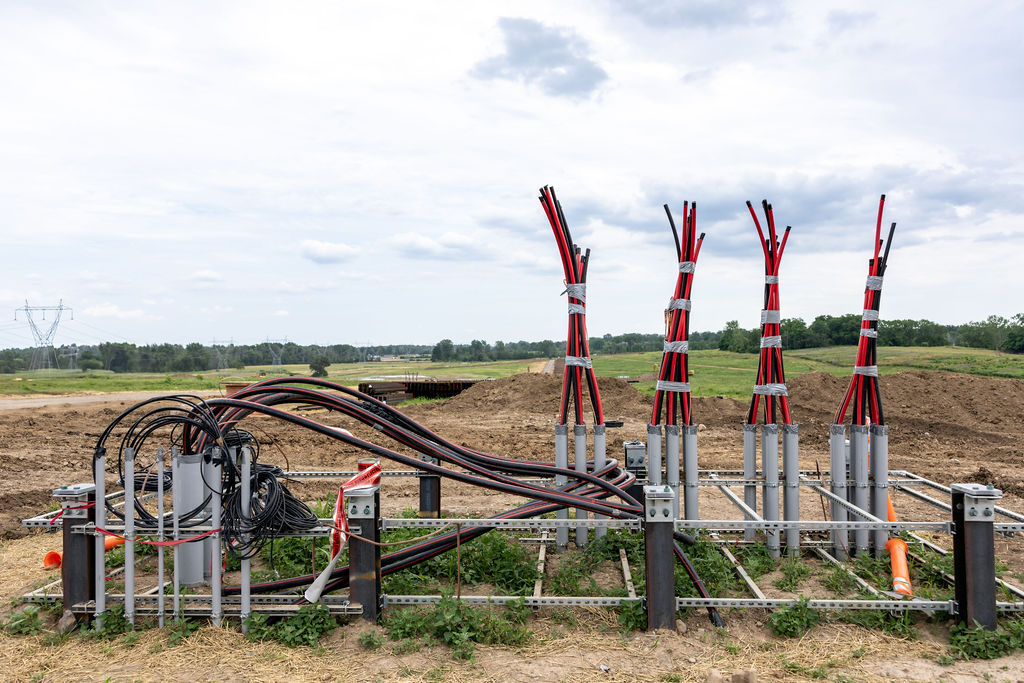
Major construction activities continued at Cider, which is both Greenbacker’s largest clean energy project to date and is expected to be New York State’s largest solar installation upon completion in 2026. This phase of construction includes the installation of electrical wiring and high-voltage utility interconnection infrastructure.
Greenbacker closed on nearly $1 billion of financing to support the acquisition, construction, and operation of Cider last year. Because the project began construction in 2024, its tax credits are grandfathered and unaffected by recent legislative changes.
The Company has also limited or eliminated Cider’s tariff risk exposure, after securing a 1 gigawatt (“GW”) order of solar modules in 2024, to be used in the construction of Cider and other pre-operating projects across Greenbacker’s infrastructure portfolios. As of the second quarter of 2025, the Company had taken early delivery of the entire order of nearly one million modules, realizing a significant discount and contributing, as previously announced, to approximately $19 million in cost savings.
Company moves 19 assets into commercial operation, representing 74 MW of new generation capacity and 16 MWh of additional energy storage to its revenue-generating operating fleet
The progress at Cider highlights how Greenbacker continues to execute on one of its core objectives: converting its pre-operating projects into operating assets generating revenue via the sale of electricity.
Over the past year, the Company brought 19 new energy assets online, including four placed into commercial operation during the second quarter of 2025. This expansion added 17 solar and two solar-plus-storage projects to Greenbacker’s operating fleet, totaling approximately 74 MW of new generation capacity and over 16 MWh of additional energy storage.
Taken together, these additional operating assets, the sale of the previously detailed solar portfolio, and other select asset divestitures resulted in a 1.3% year-over-year decrease in the Company’s operating fleet capacity. This intentional reduction reflects Greenbacker’s strategic shift toward larger-scale, higher-impact projects that both enhance portfolio quality and better position it to deliver long-term growth.
Wind and solar PPA revenue decreased 0.6% year-over-year to $44 million, contributing to total operating revenue of $51 million, as fleets produced 824,000 MWh of power.
Greenbacker generated total operating revenue of $51.4 million within its IPP segment during the second quarter of 2025, as the Company’s wind and solar fleets produced over 824 million kWh of clean power. This was driven by revenue from the long-term power purchase agreements (“PPAs”) in place across the Company’s wind and solar fleets, which together generated $44.5 million.
Despite the 1.3% year-over-year decrease in operating fleet capacity, the $44.5 million of PPA revenue delivered in the quarter represented only a 0.6% year-over-year decrease, reflecting strong performance from the higher-impact projects across the Company’s core operating fleet.
Second-quarter net loss attributable toGreenbacker in 2025 was $(33.7) million and Adjusted EBTIDA[3] was$21.6 million, representing year-over-year changes of (211)% and (2)%, respectively. The net loss was primarily driven by the one-time impacts of the operating portfolio sale and impairment related to the termination of the development of two solar projects. This was partially offset by a year-over-year decrease in depreciation and amortization, the elimination of liabilities related to certain pre-operating solar assets divested, and favorable tax-related developments regarding the monetization of tax credits related to the sale-leaseback financing of the Company’s wind repower portfolio.
Some figures may not add to stated totals due to rounding. Total clean power generated does not include power generated from a non-core biomass facility during second quarter of 2024, which Greenbacker divested in April 2024, nor does it include assets in which the Company holds a preferred equity position.
Long-term contracted revenue with high-quality counterparties provides predicable cash flow
As of June 30, 2025, approximately 93% of Greenbacker’s assets[4] were contracted to sell power to investment-grade counterparties—including utilities, municipalities, and corporations—across some of the most resilient parts of the U.S. economy.
These long-term PPAs provide the Company with highly predictable cashflows, averaging approximately 17.4 years in duration. With long-term visibility into contracted revenue, Greenbacker is well-positioned to deliver long-term value to stakeholders and confidently navigate the evolving energy transition landscape.
At quarter-end, Greenbacker’s operating fleet represented roughly 1.6 gigawatts of total clean power generation and storage capacity, spanning 30 states, territories, districts, and provinces. This geographic and technological diversity continues to reinforce the reliability and resilience of the Company’s infrastructure portfolio.
Building a more resilient clean energy future by delivering homegrown power, driving decarbonization, and supporting the domestic economy
As of June 30, 2025, Greenbacker’s portfolio of energy assets had cumulatively produced more than 13 million MWh[5] of emissions-free energy—enough to power approximately 1.2 million average U.S. homes for one year.[6] This clean energy has abated over 8 million metric tons of carbon[7] and conserved more than 9 billion gallons of water.[8]
Greenbacker’s business operations have driven more than $170 million in spending with U.S.-based manufacturers and suppliers in that period, directly supporting American industry and strengthening domestic supply chains, while advancing homegrown energy deployment.
To date, Greenbacker’s fleet of operating and pre-operating projects currently support, or are expected to support, thousands of energy-related jobs.[9]
***
About Greenbacker Renewable Energy Company
Greenbacker Renewable Energy Company LLC is a publicly reporting, non-traded limited liability sustainable infrastructure company that both acquires and manages income-producing renewable energy and other energy-related businesses, including solar and wind farms, and provides investment management services to other renewable energy investment vehicles. We seek to acquire and operate high-quality projects that sell clean power under long-term contracts to high-creditworthy counterparties such as utilities, municipalities, and corporations. We are long-term owner-operators, who strive to be good stewards of the land and responsible members of the communities in which we operate. Greenbacker conducts its investment management business through its wholly owned subsidiary, Greenbacker Capital Management, LLC, an SEC-registered investment adviser. We believe our focus on power production and asset management creates value that we can then pass on to our shareholders—while facilitating the transition toward a clean energy future. For more information, please visit https://greenbackercapital.com.
About Greenbacker Capital Management
Greenbacker Capital Management LLC is an SEC registered investment adviser that provides advisory and oversight services related to project development, acquisition, and operations in the renewable energy, energy efficiency, and sustainability industries. For more information, please visit www.greenbackercapital.com.
Forward-Looking Statements
This press release contains forward-looking statements within the meaning of the federal securities laws. Forward-looking statements are not guarantees of future performance and involve known and unknown risks, uncertainties and other factors that may cause the actual results to differ materially from those anticipated at the time the forward-looking statements are made. Although Greenbacker believes the expectations reflected in such forward-looking statements are based upon reasonable assumptions, it can give no assurance that the expectations will be attained or that any deviation will not be material. Greenbacker undertakes no obligation to update any forward-looking statement contained herein to conform to actual results or changes in its expectations.
Private placements are speculative.
For financial professionals and their accredited investors only. Not for inspection by, distribution to, or quotation to the general public. There are material risks associated with investing in alternative investments including financing risks, general economic risks, long hold periods, and potential loss of the entire investment principal. Potential cash flow, returns, and appreciation are not guaranteed. The shares offered are illiquid assets for which there is not expected to be any secondary market, nor is it expected that any will develop in the future. The ability to transfer shares is limited. Pursuant to the LLC Agreement, Greenbacker has the discretion under certain circumstances to prohibit transfers of shares, or to refuse to consent to the admission of a transferee as a member. Securities offered through WealthForge Securities, LLC, Member FINRA/SIPC. Greenbacker Capital Management LLC and WealthForge Securities, LLC are separate entities.
Non-GAAP Financial Measures
In addition to evaluating the Company’s performance on a U.S. GAAP basis, the Company utilizes certain non-GAAP financial measures to analyze the operating performance of our segments as well as our consolidated business. Each of these measures should not be considered in isolation from or as superior to or as a substitute for other financial measures determined in accordance with U.S. GAAP, such as net income (loss) or operating income (loss). The Company uses these non-GAAP financial measures to supplement its U.S. GAAP results in order to provide a more complete understanding of the factors and trends affecting its operations.
Adjusted EBITDA
Adjusted EBITDA is a non-GAAP financial measure that the Company uses as a performance measure, as well as for internal planning purposes. We believe that Adjusted EBITDA is useful to management and investors in providing a measure of core financial performance adjusted to allow for comparisons of results of operations across reporting periods on a consistent basis, as it includes adjustments relating to items that are not indicative on the ongoing operating performance of the business.
Adjusted EBITDA is a performance measure used by management that is not calculated in accordance with U.S. GAAP. Adjusted EBITDA should not be considered in isolation from or as superior to or as a substitute for net income (loss),operating income (loss) or any other measure of financial performance calculated in accordance with U.S. GAAP. Additionally, our calculations of Adjusted EBITDA may not be comparable to similarly titled measures reported by other companies.
Funds FromOperations (FFO)
FFO is a non-GAAP financial measure that the Company uses as a performance measure to analyze net earnings from operations without the effects of certain non-recurring items that are not indicative of the ongoing operating performance of the business. FFO is calculated using Adjusted EBITDA less the impact of interest expense (excluding the non-cash component) and distributions to tax equity investors under the financing facilities associated with our IPP segment.
The Company believes that the analysis and presentation of FFO will enhance our investor’s understanding of the ongoing performance of our operating business. The Company considers FFO, in addition to other GAAP and non-GAAP measures, in assessing operating performance and as a proxy for growth in distribution coverage over the long term.
FFO should not be considered in isolation from or as a superior to or as a substitute for net income (loss), operating income (loss)or any other measure of financial performance calculated in accordance with U.S. GAAP.
General Disclosure
This information has been prepared solely for informational purposes and is not an offer to buy or sell or a solicitation of an offer to buy or sell any security, or to participate in any trading or investment strategy. The information presented herein may involve Greenbacker’s views, estimates, assumptions, facts, and information from other sources that are believed to be accurate and reliable and are, as of the date this information is presented, subject to change without notice.
.png)
Non-GAAP Reconciliations
Adjusted EBITDA
Adjusted EBITDA is a non-GAAP financial measure that the Company uses as a performance measure as well as for internal planning purposes. We believe that Adjusted EBITDA is useful to management and investors in providing a measure of core financial performance adjusted to allow for comparisons of results of operations across reporting periods on a consistent basis as it includes adjustments relating to items that are not indicative of the ongoing operating performance of the business.
The Company defines Adjusted EBITDA as net income (loss) before: (i) interest expense; (ii)income taxes; (iii) depreciation expense; (iv) amortization expense (including contract amortization); (v) accretion; (vi) impairment of long-lived assets;(vii) amounts attributable to our redeemable and non-redeemable non controlling interests; (viii) unrealized gains and losses on financial instruments; (ix)gains and losses for asset dispositions; (x) other income (loss); and (xi)foreign currency gain (loss). Additionally, the Company further adjusts for the following items described below:
- Share-based compensation is excluded from Adjusted EBITDA as it is different from other forms of compensation as it is a non-cash expense and is highly variable. For example, a cash salary generally has a fixed and unvarying cash cost. In contrast, the expense associated with an equity-based award is generally unrelated to the amount of cash ultimately received by the employee, and the cost to the Company is based on a share-based compensation valuation methodology and underlying assumptions that may vary over time.
- The change in fair value of contingent consideration, which is related to the Acquisition, is excluded from Adjusted EBITDA, if any such change occurs during the period. The non-cash, mark-to-market adjustments are based on the expected achievement of revenue targets that are difficult to forecast and can be variable, making comparisons across historical and future quarters difficult to evaluate.
- Start-up costs associated with new investment strategies is excluded from Adjusted EBITDA. The Company evaluates new investment strategies on a regular basis and excludes start-up cost from Adjusted EBITDA until such time as a new strategy is determined to form part of the Company’s core investment management business.
- Placement fees, including internal sales commissions, related to fundraising efforts based on the capital raised, are excluded from Adjusted EBITDA. By excluding these fundraising-related fees from Adjusted EBITDA, we focus on core operational performance, separate from capital raising efforts, which might vary significantly from period to period.
- Other costs that are not consistently occurring, not reflective of expected future operating expense and provide no insight into the fundamentals of current or past operations of our business are excluded from Adjusted EBITDA. This includes costs such as professional services and legal fees, and other non-recurring costs unrelated to the ongoing operations of the Company.
Adjusted EBITDA is a performance measure used by management that is not calculated in accordance with U.S. GAAP. Adjusted EBITDA should not be considered in isolation from or as superior to or as a substitute for net income (loss), operating income (loss) or any other measure of financial performance calculated in accordance with U.S. GAAP. Additionally, our calculations of Adjusted EBITDA may not be comparable to similarly titled measures reported by other companies.
FFO
FFO is a non-GAAP financial measure that the Company uses as a performance measure to analyze net earnings from operations without the effects of certain non-recurring items that are not indicative of the ongoing operating performance of the business.
FFO is calculated using Adjusted EBITDA less the impact of interest expense (excluding the non-cash component) and distributions to Tax Equity Investors under the financing facilities associated with our IPP segment. The Company excludes these distributions as these are not recorded within Adjusted EBITDA and is therefore not a component of our earnings from operations.
The Company believes that the analysis and presentation of FFO will enhance our investors’ understanding of the ongoing performance of our operating business. The Company considers FFO, in addition to other GAAP and non-GAAP measures, in assessing operating performance and as a proxy for growth in distribution coverage over the long-term.
Adjusted EBITDA and FFO should not be considered in isolation from or as a superior to or as a substitute for net income (loss), operating income (loss) or any other measure of financial performance calculated in accordance with U.S. GAAP.
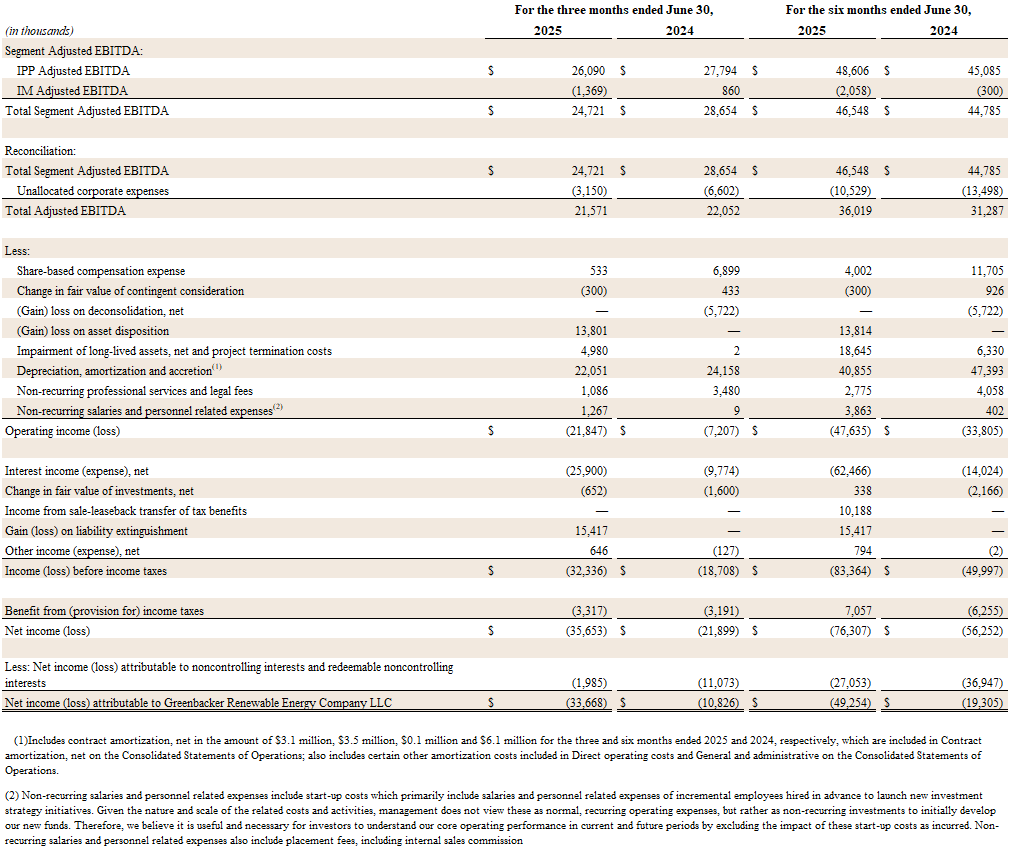
The following table reconciles Net loss attributable to Greenbacker Renewable Energy Company LLC to Adjusted EBITDA and FFO:

The following table reconciles total Segment Adjusted EBITDA to Net loss attributable to Greenbacker Renewable Energy Company LLC:
Greenbacker media contact
Chris Larson
Media Communications
646.569.9532
c.larson@greenbackercapital.com
***
[1] The financial and portfolio metrics set forth herein are unaudited and subject to change. Data as of June 30, 2025.Total assets and megawatts statistics include those projects where we have contracted for the acquisition of the project pursuant to a Membership Interest Purchase Agreement (“MIPA”).
[2] One interconnection is considered to be one “asset;” a single project with multiple interconnection counts is considered to be multiple assets.
[3] Adjusted EBITDA is a non-GAAP financial measure that the Company uses as a performance measure, as well as for internal planning purposes. We believe that Adjusted EBITDA is useful to management and investors in providing a measure of core financial performance adjusted to allow for comparisons of results of operations across reporting periods on a consistent basis, as it includes adjustments relating to items that are not indicative on the ongoing operating performance of the business. See “Non-GAAP Financial Measures” for additional discussion. Adjusted EBITDA is unaudited. See the Company’s 10-Qfiled with the SEC for additional financial information and important related disclosures.
[4] Includes both operating and pre-operating clean energy projects within the Greenbacker portfolio.
[5] Since January 2016.
[6] Based on the U.S. Energy Information Administration’s estimate that the average annual amount of electricity used by a U.S. residential electric-utility customer is 10,791kilowatt-hours (kWh).
[7] Data is asof June 30, 2025. When compared with a similar amount of power generation from fossil fuels. Carbon abatement is calculated using the EPA Greenhouse Gas Equivalencies Calculator which uses the Avoided Emissions and generation Tool (AVERT) US national weighted average CO2 marginal emission rate to convertreductions of kilowatt-hours into avoided units of carbon dioxide emissions.
[8] Data is as of June 30, 2025. Water saved by Greenbacker’s clean energy projects is compared to the amount of water needed to produce the same amount of power by burning coal. Gallons of water saved are calculated based on Operational water consumption and withdrawal factors for electricity generating technologies: a review of existing literature – IOPscience, JMacknick et al 2012 Environ. Res. Lett. 7 045802.
[9] Data is as of June 30, 2025. Green jobs calculated using The National Renewable Energy Laboratory (NREL) State Clean Energy Employment Projection Support, nrel.gov.